This post is automatically translated with LLM. The translation content has NOT been reviewed and may contain errors.
Root Cause
I recently developed a VPS monitoring system using PHP, consisting of both server-side and client-side components. At 3 PM today, I added a service monitoring feature to check running services on VPS instances. Since all my VPSes run Debian 8, I used service --status-all to retrieve service statuses. After successful testing, I moved on to other tasks.
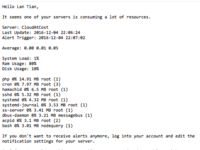
Around 9 PM, I received an alert email from NodeQuery indicating high memory usage on one of my VPS instances since 7 PM.
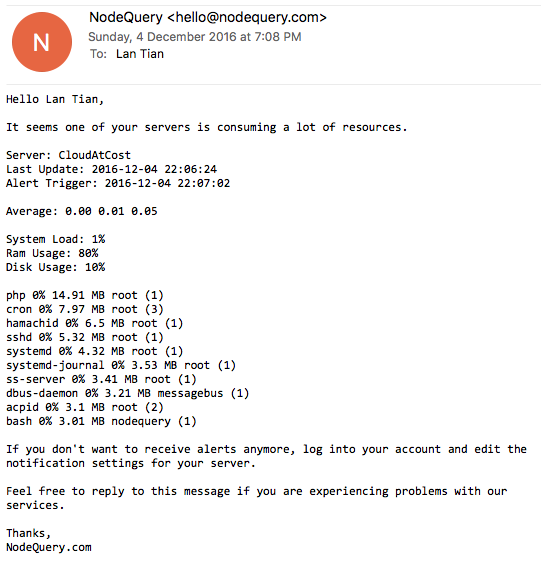
Checking my monitoring system, I found this VPS consuming 400M/500M memory. Another VPS showed even higher usage at 600M/1G, though it didn't trigger alerts due to larger total memory.
The mystery was: How could these VPSes running only Shadowsocks and ServerSpeeder consume so much memory? Using ps -aux revealed no processes with such high memory usage.
Is ServerSpeeder the Culprit?
My first suspect was ServerSpeeder. As the official version is no longer available to new users, we use a modified version. Stopping ServerSpeeder with /serverspeeder/bin/serverSpeeder.sh stop reduced memory by dozens of MB, but usage remained high. After rebooting, memory normalized temporarily.
However, hours later, my monitoring system showed memory climbing again at 1MB/minute. ps -aux still showed nothing unusual.
Something was definitely wrong!
Investigation
With normal process listings, I suspected kernel issues. However, another VPS with identical setup (hosting this blog) showed normal memory usage around 300M/500M despite unoptimized MySQL settings.
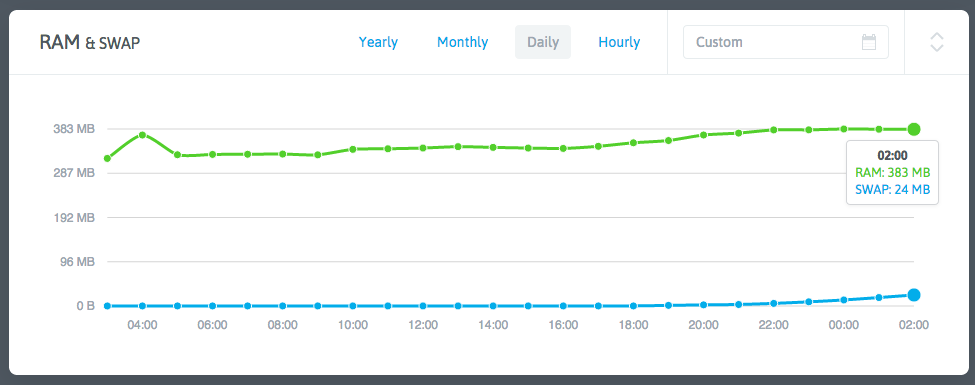
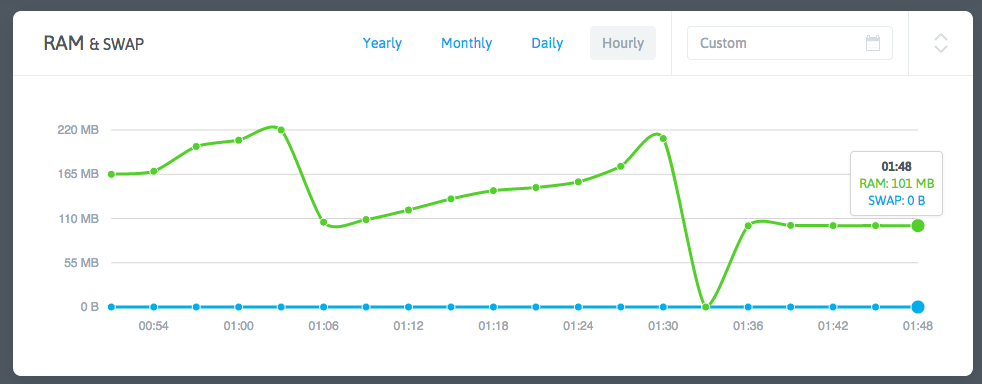
Reviewing NodeQuery data for affected VPSes revealed:
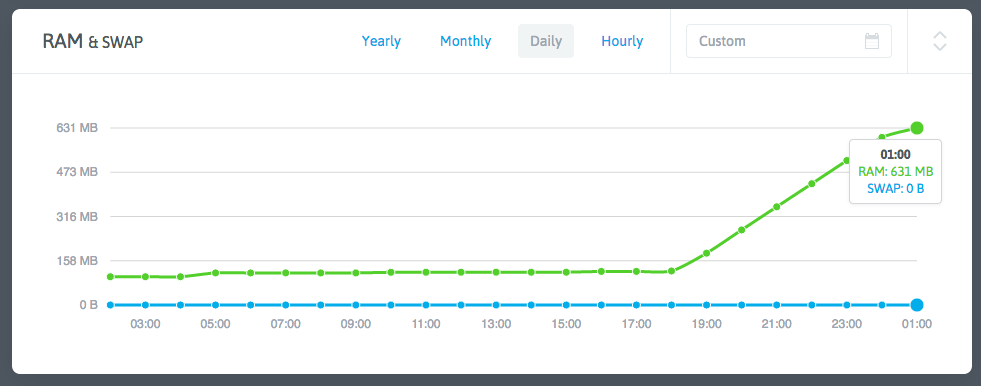
The memory spike coincided with when I added the service monitoring feature 7 hours prior. But how could a simple PHP script reading /proc files and executing basic commands cause leaks? PHP itself is reliable.
PHP is the best language in the world.

I focused on the service --status-all command. Repeated execution of service --status-all > /dev/null && free -m showed memory increasing by 1MB per run - matching the symptom!
Who was consuming this memory? Research led me to 《Investigating a Memory Usage Issue》, explaining Linux's Slab memory mechanism. While some Slab memory is reclaimable, free -m and my monitoring script didn't account for it.
Checking /proc/meminfo showed 100MB Slab memory (mostly SUnreclaim) shortly after reboot. Repeated execution of:
service --status-all > /dev/null && cat /proc/meminfo | grep SUnreclaimconfirmed SUnreclaim growth.
Further tests revealed:
- Output redirection to files didn't resolve the issue
- Individual service checks (
service [name] status) showed no leaks - The leak only occurred with
service --status-all
ServerSpeeder Confirmed as Culprit
By process of elimination, I identified /etc/init.d/serverSpeeder as the leak source when running service --status-all. Removing the init script and manually starting via /etc/rc.local resolved the issue.
I plan to further analyze ServerSpeeder's scripts to identify the exact leak source.